
How much of your website traffic is actually human?
We checked ours. Between September 28 and October 27, 2026, position.digital served roughly 254,000 HTML pages. About 9,800 of them were loaded by a real person in a real browser. Everything else was automated: search engine crawlers, AI assistants, SEO tools, security scanners, and a large crowd of bots pretending to be Chrome.
Leave out our own uptime monitor, and 95.4% of the pages we served went to bots.
Key Findings
- Only 1 in 22 page views came from a person. Of roughly 211,000 pages served (excluding our own uptime monitor), about 9,800 ran in a human’s browser.
- Half of all our traffic came from bots disguised as browsers. 48.5% of page views claimed to be Chrome, Safari, or Firefox but never ran a line of JavaScript.
- AI bots made 2.7 requests for every human page view. AI crawlers, AI search indexers, and AI assistants together accounted for 12.6% of all page views.
- AI assistants fetched our pages almost as often as people loaded them. ChatGPT, Claude, Meta AI, and others fetched 8,780 pages on behalf of their users, 0.9 for every human page view.
- AI assistants read far more than they refer. Googlebot crawled about 11 pages for every visit Google sent us. OpenAI’s bots requested well over 100 pages for every visit we could trace back to ChatGPT.
- AI assistants mostly read our most frequently updated pages. Our AI SEO news feed, homepage, and AI SEO statistics page took over 70% of ChatGPT’s fetches.
- We’re not alone: bots now make most web page requests. Across Cloudflare’s network, bots made 65.1% of HTML page requests over the same period, up from 53% at the end of 2025.
- For every two pages we served, bots requested one that doesn’t exist. 121,650 requests hit a 404, most of them hunting for leaked passwords, API keys, and WordPress backdoors.
Methodology: How We Measured Our Traffic
position.digital runs on Cloudflare, so every request to the site passes through Cloudflare’s network before it reaches us. That gives us two independent views of the same 30 days (September 28 to October 27, 2026):
- Every HTML page we served. Cloudflare’s HTTP request analytics log the user agent of each request. We kept only successful (200) HTML responses on www.position.digital, which gave us 253,830 page views. We excluded images, scripts, redirects, errors, and our staging and client subdomains.
- Every page that ran in a real browser. Cloudflare Web Analytics adds a small, cookieless script to each page. It only reports back when a browser actually runs JavaScript, which almost no crawler does. It recorded 9,940 page loads. We removed 180 that came from headless Chrome (an automated browser), leaving 9,760 human page views.
We then sorted every user agent into one of 11 categories (AI assistant, AI search indexer, AI training crawler, search engine, SEO tool, and so on) by matching the bot names that operators publish. Anything claiming to be a normal browser went into a “browser-like” bucket. Comparing that bucket with the 9,760 page loads that actually ran JavaScript tells us how much of it was automation in disguise.
Two notes before the results:
- Our own uptime monitor made 43,000 requests (16.9% of all page views): a health check roughly once a minute. It’s real bot traffic, but it’s traffic we created, so the headline figures below leave it out. Include it and the bot share rises from 95.4% to 96.2%.
- Cloudflare samples its analytics, so all figures are estimates rounded to the nearest 10. The totals are large enough for that not to matter. It does matter for small numbers, such as referrals from individual AI apps, and we flag those where they appear.
Only 1 in 22 Page Views Came From a Person
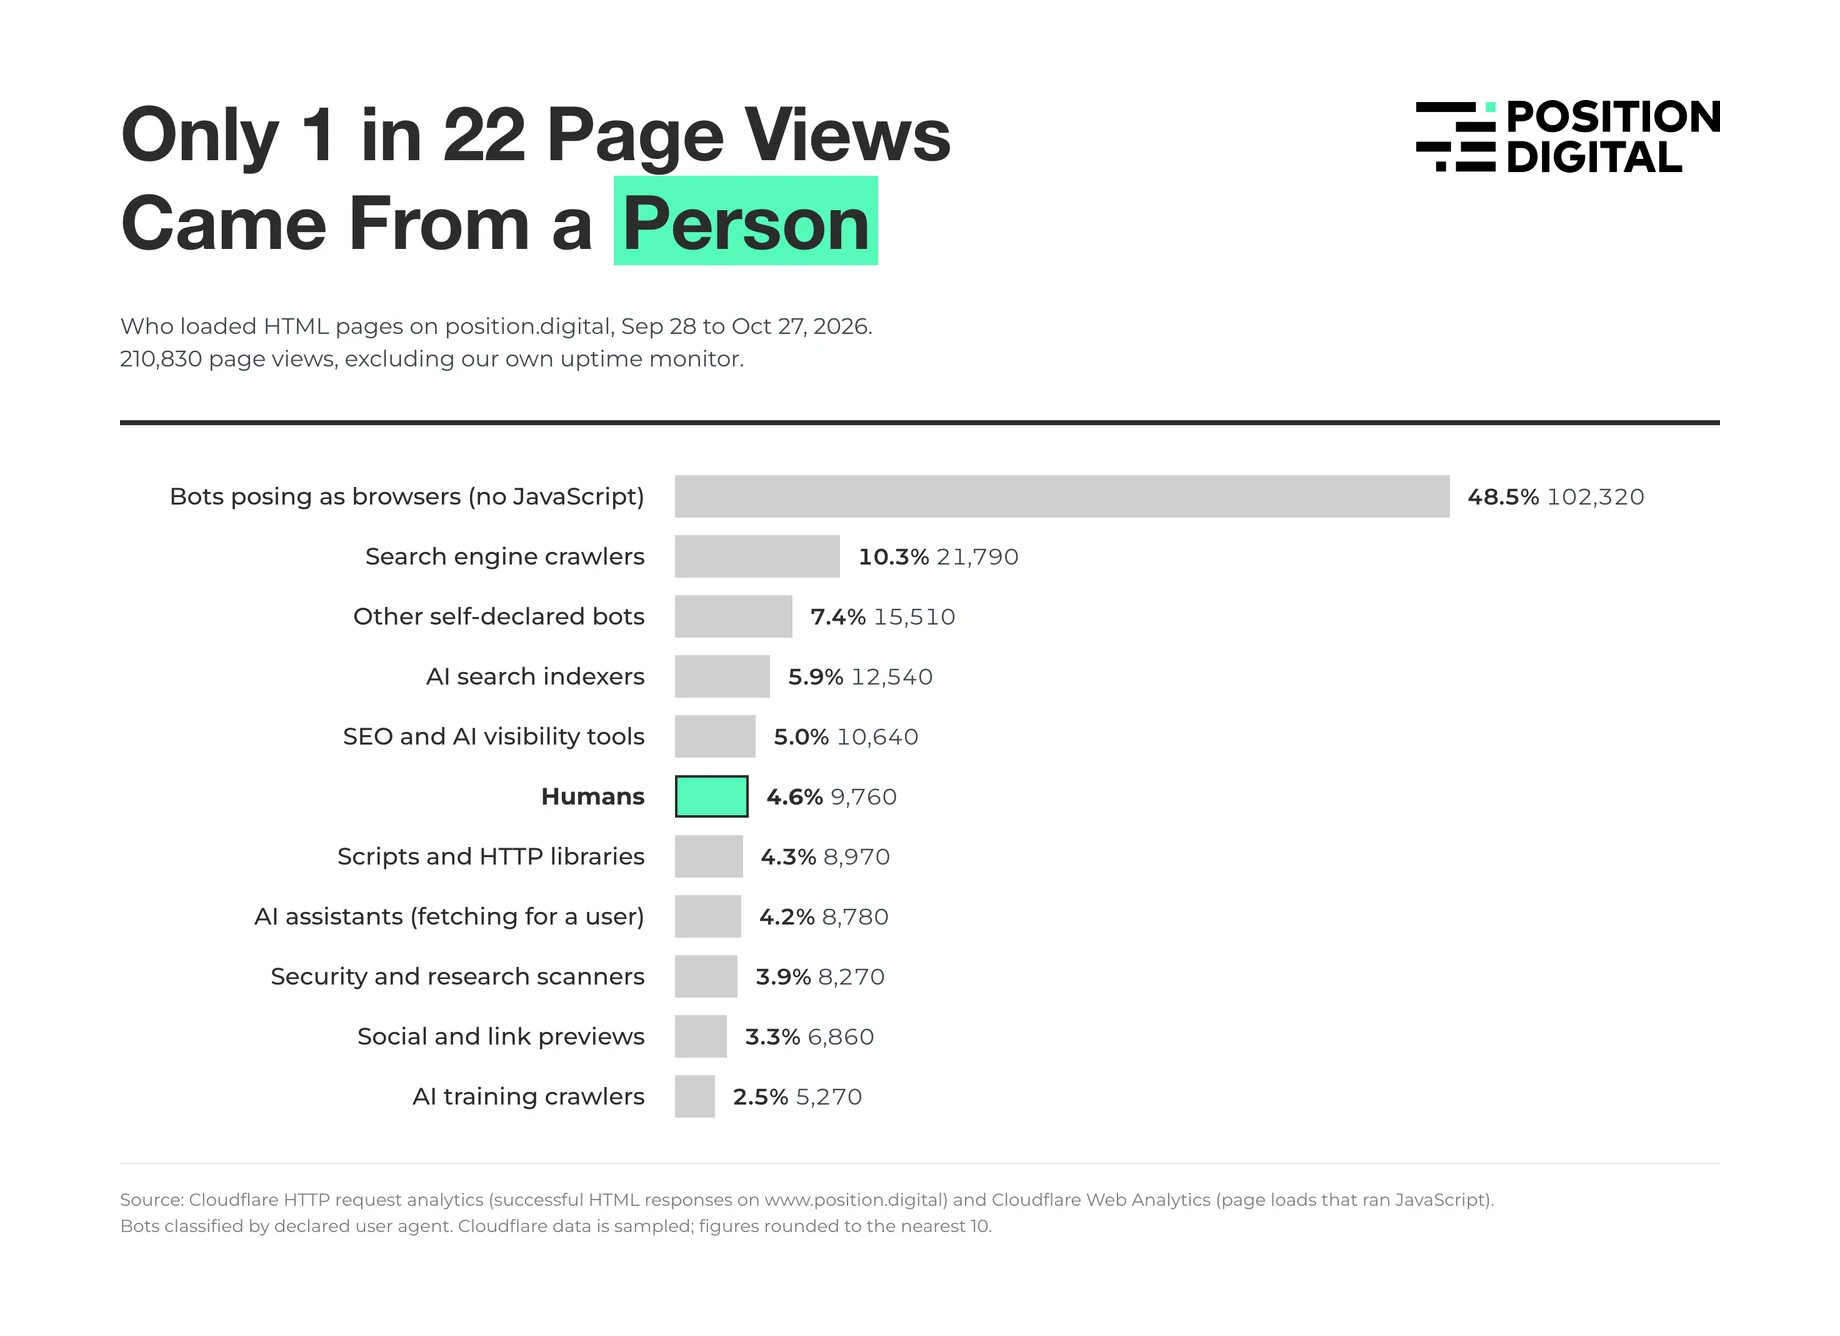
Here is where our 210,830 page views went (excluding our own uptime monitor):
| Traffic source | Page views | Share |
| Bots posing as browsers (no JavaScript) | 102,320 | 48.5% |
| Search engine crawlers | 21,790 | 10.3% |
| Other self-declared bots | 15,510 | 7.4% |
| AI search indexers | 12,540 | 5.9% |
| SEO and AI visibility tools | 10,640 | 5.0% |
| Humans | 9,760 | 4.6% |
| Scripts and HTTP libraries | 8,970 | 4.3% |
| AI assistants (fetching for a user) | 8,780 | 4.2% |
| Security and research scanners | 8,270 | 3.9% |
| Social and link previews | 6,860 | 3.3% |
| AI training crawlers | 5,270 | 2.5% |
Humans are the sixth-largest group visiting our site. There were more AI search indexer requests than human page views, and roughly as many AI assistant fetches.
This matters because a raw page view count from your server, CDN, or hosting dashboard is not a measure of your audience. If we reported “254,000 page views last month”, the real number of pages people read would be overstated 26 times.
Half of Our Traffic Was Bots Posing as Chrome
The largest group wasn’t a named bot at all. 112,080 page views claimed to come from an ordinary browser, but only 9,760 of those page loads ever ran JavaScript. The other 102,320 (48.5% of all traffic) were automated tools using a browser’s identity.
One user agent string alone, an outdated Chrome 138 on Linux, made 27,100 requests: 12.9% of our page views, nearly three times our total human traffic. Real Chrome users update automatically. A fixed, older version number sending thousands of requests is a scraper using a default setting.
Most of this traffic is undeclared scraping: content aggregators, price and data scrapers, and AI companies that don’t identify themselves. It’s the traffic that robots.txt can’t control, because these bots don’t announce who they are.
AI Bots Now Outnumber Our Human Readers
AI-related bots made 26,590 requests in 30 days, 12.6% of our page views, or 2.7 for every page a human read. They fall into three groups that behave very differently:
| AI bot type | What it does | Page views | Largest bots |
| AI search indexers | Build the index AI answers draw from | 12,540 | ExaSearchBot (3,720), Meta’s web indexer (3,510), PerplexityBot (2,450), OAI-SearchBot (1,320), Azure AI Search (1,210) |
| AI assistants | Fetch a page live because a user asked a question | 8,780 | ChatGPT-User (3,850), Claude-User (2,780), Meta AI link fetcher (1,600) |
| AI training crawlers | Collect text to train future models | 5,270 | Meta-ExternalAgent (980), Amazonbot (930), Bytespider (660), GPTBot (560), ClaudeBot (550) |
The split surprised us. Training crawlers were the smallest group. Most AI traffic to our site was retrieval: building search indexes, or reading a page right now to answer someone’s question. That is the traffic that decides whether you appear in AI answers, and it’s the traffic most worth letting in.
Two details stood out:
- 82% of Claude-User fetches came from Claude Code, Anthropic’s coding tool, rather than the Claude chat app. Developers and agents are reading web pages as part of their work. Some of these are almost certainly our own team, who use Claude Code daily, so treat Claude’s numbers as an upper bound.
- AI visibility tools now crawl like SEO tools. Alongside Semrush (1,840) and Ahrefs (3,020 across its two bots), we logged crawlers from AI visibility and GEO platforms such as Peec AI, ShapBot, and GrowthX.
AI Assistants Read Our Pages but Rarely Send Visitors
Cloudflare Web Analytics also records which site each human visitor came from, so we can compare how often each platform read our pages with how often it sent us a visitor.
| Platform | Bot requests | Human visits referred | Requests per visit |
| 15,470 (Googlebot, GoogleOther) | ~1,460 | ~11 | |
| OpenAI | 5,730 (ChatGPT-User, OAI-SearchBot, GPTBot) | ~40 | ~140 |
| Anthropic | 3,360 (Claude-User, ClaudeBot, Claude-SearchBot) | Too few to measure | n/a |
| Perplexity | 2,490 (PerplexityBot, Perplexity-User) | Too few to measure | n/a |
Treat the AI ratios as rough. Referral counts this small are heavily affected by sampling, and AI apps often open links without passing a referrer, so some of their visitors show up as “direct” traffic. The real ratio for ChatGPT is probably lower than 140 to 1. It is not close to Google’s.
This is the trade AI search is built on. ChatGPT read our pages almost 4,000 times to answer its users’ questions. Some of those answers will have named or cited Position Digital, which is the visibility we want. Very few of those users clicked through. If you measure AI search only by referral traffic, you’ll miss most of what’s happening.
Which Pages AI Assistants Read Most
AI assistants didn’t read our site evenly. These are the pages ChatGPT and Claude fetched most often on behalf of their users:
| Page | ChatGPT-User share | Claude-User share |
| AI SEO news | 28% | 22% |
| Homepage | 25% | 5% |
| AI SEO statistics | 18% | 9% |
| ChatGPT ranking factors | 1% | 13% |
| Best AI visibility tracking tools | 3% | 10% |
| Best SEO and GEO APIs | 3% | under 2% |
The pattern is clear: AI assistants go to pages that are updated often and packed with dated numbers. Our AI SEO news feed changes several times a week and is the most fetched page on the site by both assistants. Our statistics roundup and our original ChatGPT ranking factors study follow. Assistants answering “what’s new” or “what does the data say” questions look for exactly that kind of page.
ChatGPT also fetched our homepage heavily, which fits how it handles questions about a named company: it checks the brand’s own site first.
The Bots Nobody Talks About: Monitors and Scanners
AI gets the headlines, but some of our biggest bot sources had nothing to do with AI.
Our own uptime monitor generated 43,000 page views, 16.9% of the total, which is more than four times our human traffic. Monitoring is essential, but a once-a-minute check against a full HTML page inflates every server-side traffic figure you look at. If you use one, point it at a lightweight health-check URL.
Security scanners and vulnerability probes were everywhere. Named research scanners made 8,270 page requests, and the real scale shows up in the errors. Over the same 30 days, 121,650 HTML requests hit a page that doesn’t exist on our site. The most requested missing URLs were:
/.env,/static/.env,/api/.env,/deploy/.env: files that often hold passwords and API keys/.git/configand/.git-credentials: source code and repository credentials/credentials.json,/serviceAccountKey.json,/google-service-account.json: cloud account keys/wp-includes/images/smilies/about.php,/alfa.php: known WordPress backdoor paths
We no longer run WordPress, and bots are still knocking on its old doors. None of those files exist on our site, but this is a reminder that anything accidentally left in a public folder will be found within days.
How Our Numbers Compare With the Wider Web
Our site is an extreme case, but it isn’t an exception. Studies that measure what we measured, requests for web pages, now agree that most of them come from bots.
| Study | What it measured | Bot share |
| Cloudflare Radar (Sep 30 to Oct 28, 2026) | HTML page requests across Cloudflare’s network, worldwide | 65.1% |
| Cloudflare Radar 2025 Year in Review | HTML page requests across Cloudflare’s network, as of Dec 2, 2025 | 53% |
| F5 Labs 2025 Advanced Persistent Bots Report | Page requests for web content, 207 billion transactions, Nov 2023 to Sep 2024 | 50.04% |
| Imperva 2026 Bad Bot Report | All web traffic across Imperva’s network in 2025 | Over 53% |
| position.digital (this study) | HTML page views on our site, Sep 28 to Oct 27, 2026 | 95.4% |
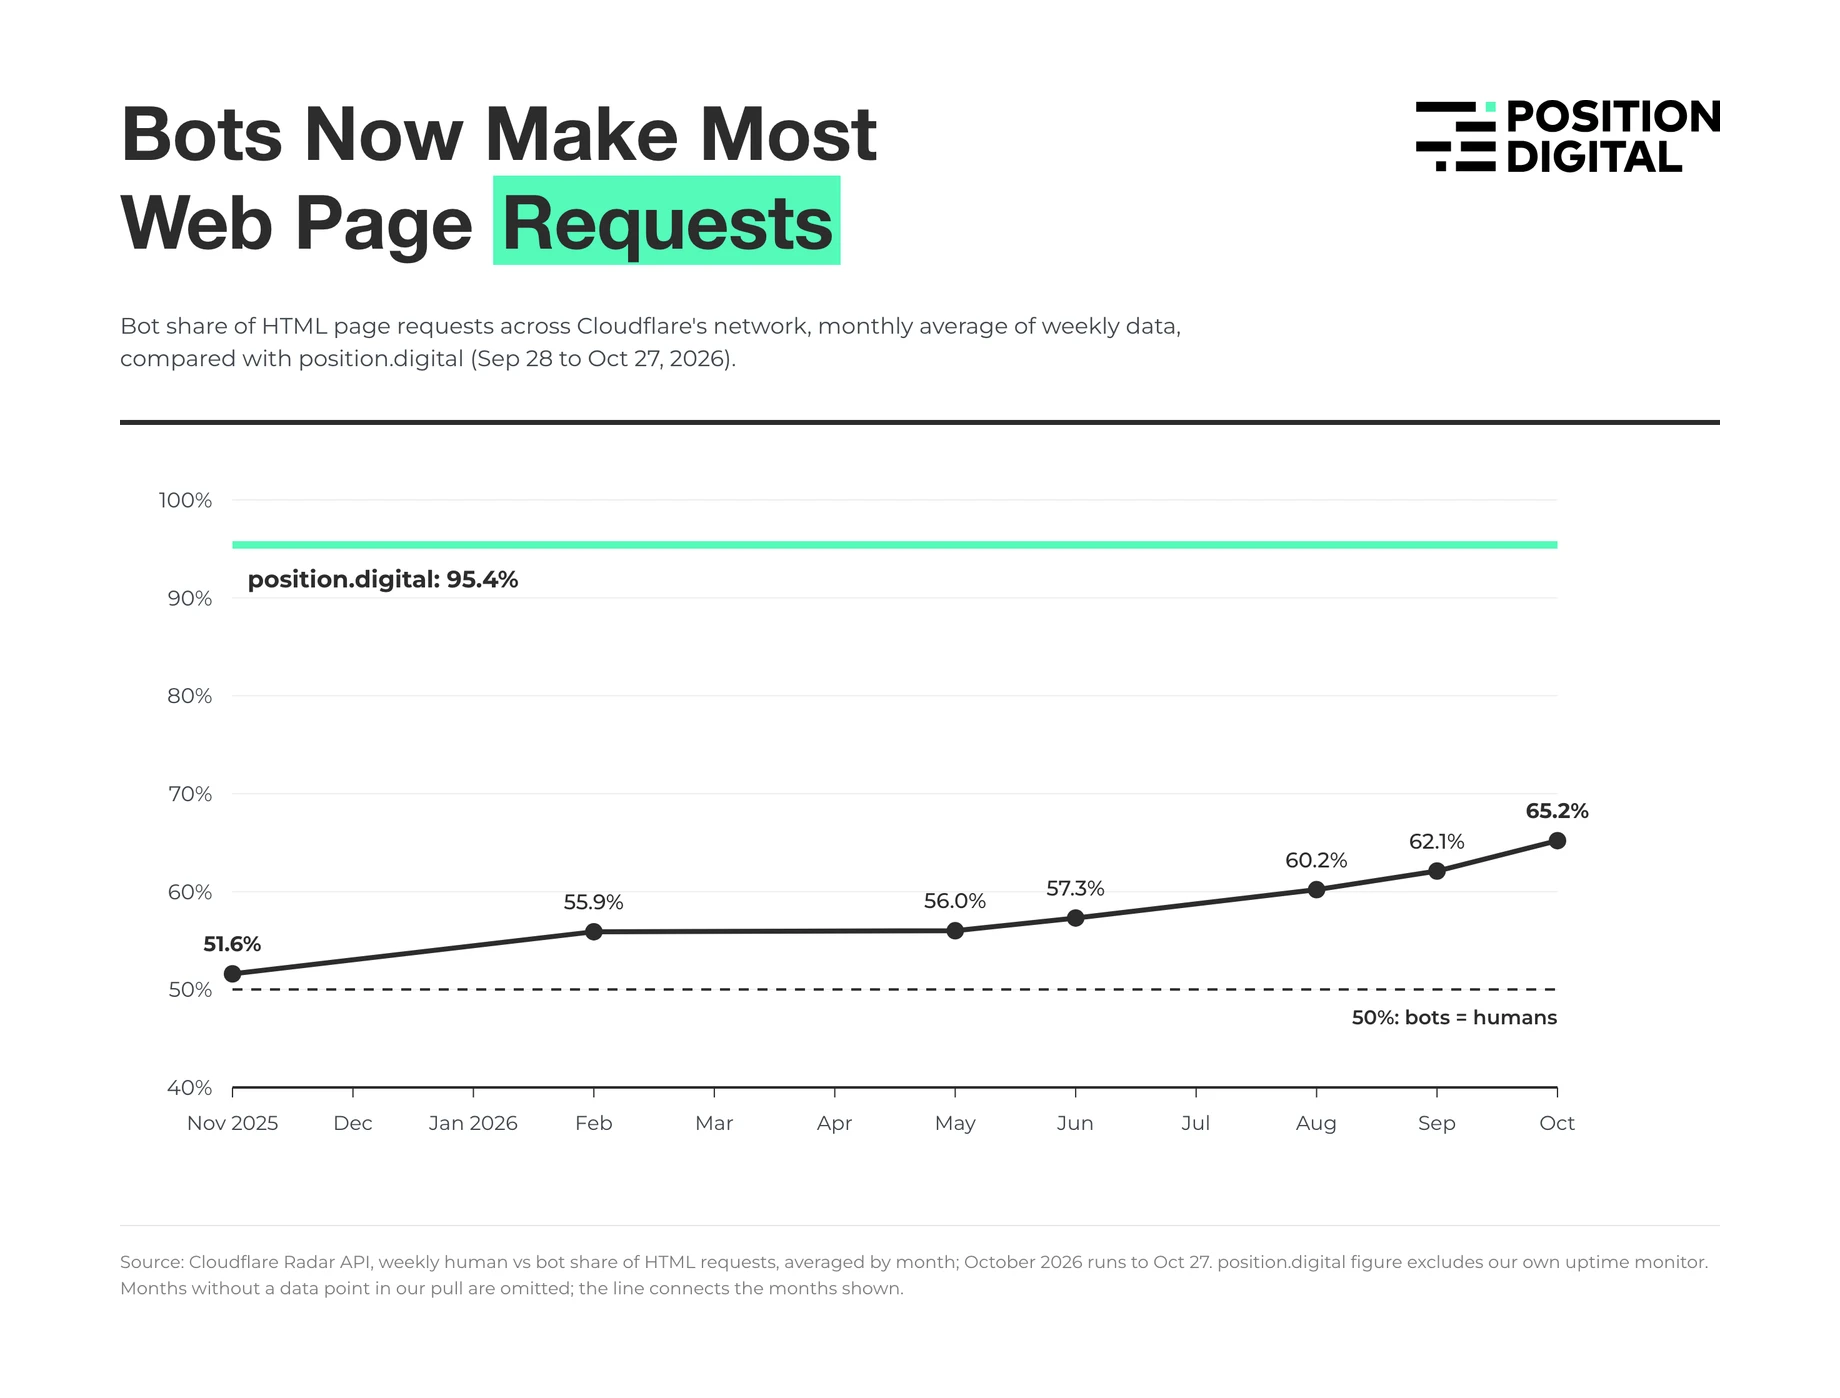
The tipping point has already passed. Cloudflare’s 2025 Year in Review, which looked only at HTML page requests, found humans made just 47% of them by December 2025. Radar’s weekly data shows bots above 50% of page requests for the whole of the past year, and their share rising almost every month:
| Month | Bot share of HTML page requests (Cloudflare) |
| November 2025 | 51.6% |
| February 2026 | 55.9% |
| May 2026 | 56.0% |
| June 2026 | 57.3% |
| August 2026 | 60.2% |
| September 2026 | 62.1% |
| October 2026 (to Oct 27) | 65.2% |
Source: Cloudflare Radar API, weekly human vs bot share of HTML requests, averaged by month.
Bots are also growing much faster than people. HUMAN Security’s 2026 State of AI Traffic report found that automated traffic grew 23.5% in 2025, nearly eight times faster than human traffic (3.1%), while AI-driven traffic grew 187% over the year. Akamai reported that AI bot activity rose 300% in 2025.
Measures that count every request, rather than just pages, show a lower bot share: Radar puts bots at 39.3% of all HTTP requests over the same period. That’s because people’s browsers also download images, fonts, scripts, and API data with every page they open, while most bots only want the HTML. When the question is “who is reading my pages?”, the page-level figure is the one that matters.
Why Our Bot Share Is So Much Higher
The web average for pages is about 65% bots. Ours is 95%. Two reasons:
- We’re a small B2B site. Bots crawl roughly the same number of pages whether a site gets 100 visitors or 100,000. The smaller the human audience, the larger the bot share. Most B2B and SaaS company sites are in the same position.
- We write about AI search. Pages about AI and SEO attract AI assistants, AI visibility tools, and SEO crawlers, so a marketing agency site is a busier target than average.
If you run a B2B site with a few thousand human visits a month, expect your page-level bot share to look more like ours than like the internet average.
What This Means for Your Analytics and AI Visibility
- Don’t trust raw page view counts. Server logs, CDN dashboards, and hosting analytics count bots. Use JavaScript-based analytics (GA4, Plausible, Cloudflare Web Analytics) for audience numbers, and know that even those catch some headless browsers.
- Track AI assistant fetches as a visibility signal. ChatGPT-User, Claude-User, and Perplexity-User requests mean someone asked an AI a question and it read your page to answer. That’s closer to an impression than a crawl. Count them by page each month alongside your referral traffic, and use a tool like our free AI citation extractor to see which sources AI answers cite for your topics.
- Make your key pages readable without JavaScript. AI assistants and indexers fetch raw HTML. If your content only appears after JavaScript runs, many of them see an empty page.
- Keep your most cited pages fresh. The pages assistants fetched most were the ones we update most often. If a page is meant to be cited, give it dated figures and update it regularly.
- Decide on AI bots by type, not all at once. Blocking training crawlers (GPTBot, ClaudeBot, CCBot) has a very different effect from blocking assistants and search indexers (ChatGPT-User, OAI-SearchBot, PerplexityBot). Block the second group and you remove yourself from AI answers.
- Point uptime checks at a health-check URL, not a full page, so they stop inflating your traffic.
- Keep secrets out of public folders. Bots check for
.envfiles and Git folders on every site, every day.
Not sure whether AI assistants can read and cite your key pages? Our GEO audit checks what AI crawlers and assistants see on your site and what to fix first.
Limitations
- One site, 30 days. This is position.digital’s traffic only, from September 28 to October 27, 2026. A large consumer site will see a very different mix.
- The human count is an estimate. Some privacy extensions block Cloudflare’s analytics script, so a share of real visitors is missing from our 9,760. If as many as a third of human page loads were blocked, the bot share would still be 93.1%. In the other direction, a few automated browsers that run JavaScript may be counted as human.
- User agents can lie. We classified bots by the name they declare. A scraper can claim to be Googlebot. On Cloudflare’s free plan we can’t verify a bot’s network, so some of the named-bot figures may include impostors.
- Sampled data. Cloudflare’s analytics are sampled, so small figures (especially the AI referral counts) carry wide margins of error.
- Some fetches are probably ours. Our team uses AI tools such as Claude Code and our own AI citation extractor on our own site, so a share of the Claude-User figure is likely self-generated.