Data-driven content gives you a competitive advantage to win in AI search.
Why? Because AI is great at summarizing the world’s information, but it can’t create new information.
When you have original numbers or statistics that no one else has, large language models (LLMs) have no option but to cite your content.
This guide shows you the steps of collecting first-party data and structuring it for AI extraction.
Why AI Systems Reward Data-Driven Content
A GEO study by Pranjal Aggarwal and several other researchers found that adding statistics and citations can boost AI visibility by 40%.
There are two primary reasons why data-driven content wins AI citations:
Information gain
AI can scan and synthesize the world’s information in seconds.
If you simply repeat what others have covered without adding something new to the conversation, AI has no reason to pick your content as its source.
Original research is how you contribute new knowledge—through surveys, experiments, proprietary data, case studies, or unique analysis that AI cannot find elsewhere.
Credibility and verifiability
Statistics, citations, and transparent methodologies make content easier to trust.
When claims are supported by reputable sources or original data, AI systems have stronger signals that the information is reliable.
For example, LLMs are more likely to cite specific, verifiable claims like:
“70% of US adults use AI to search for information”
Rather than vague statements like:
“AI is becoming more popular among American adults.”
The first sentence is a concrete fact that an AI can attribute to a source. The second is a general observation that the model can easily paraphrase without citing.
3 Ways to Produce Proprietary Data
Here are proven ways we collect, analyze, and publish first-party data for Position Digital and our clients.
1. Mine client data
You don’t need to hire an expensive research firm to produce original data; you’re already sitting on a valuable dataset: your client results.
No competitor has that access, so take full advantage of it.
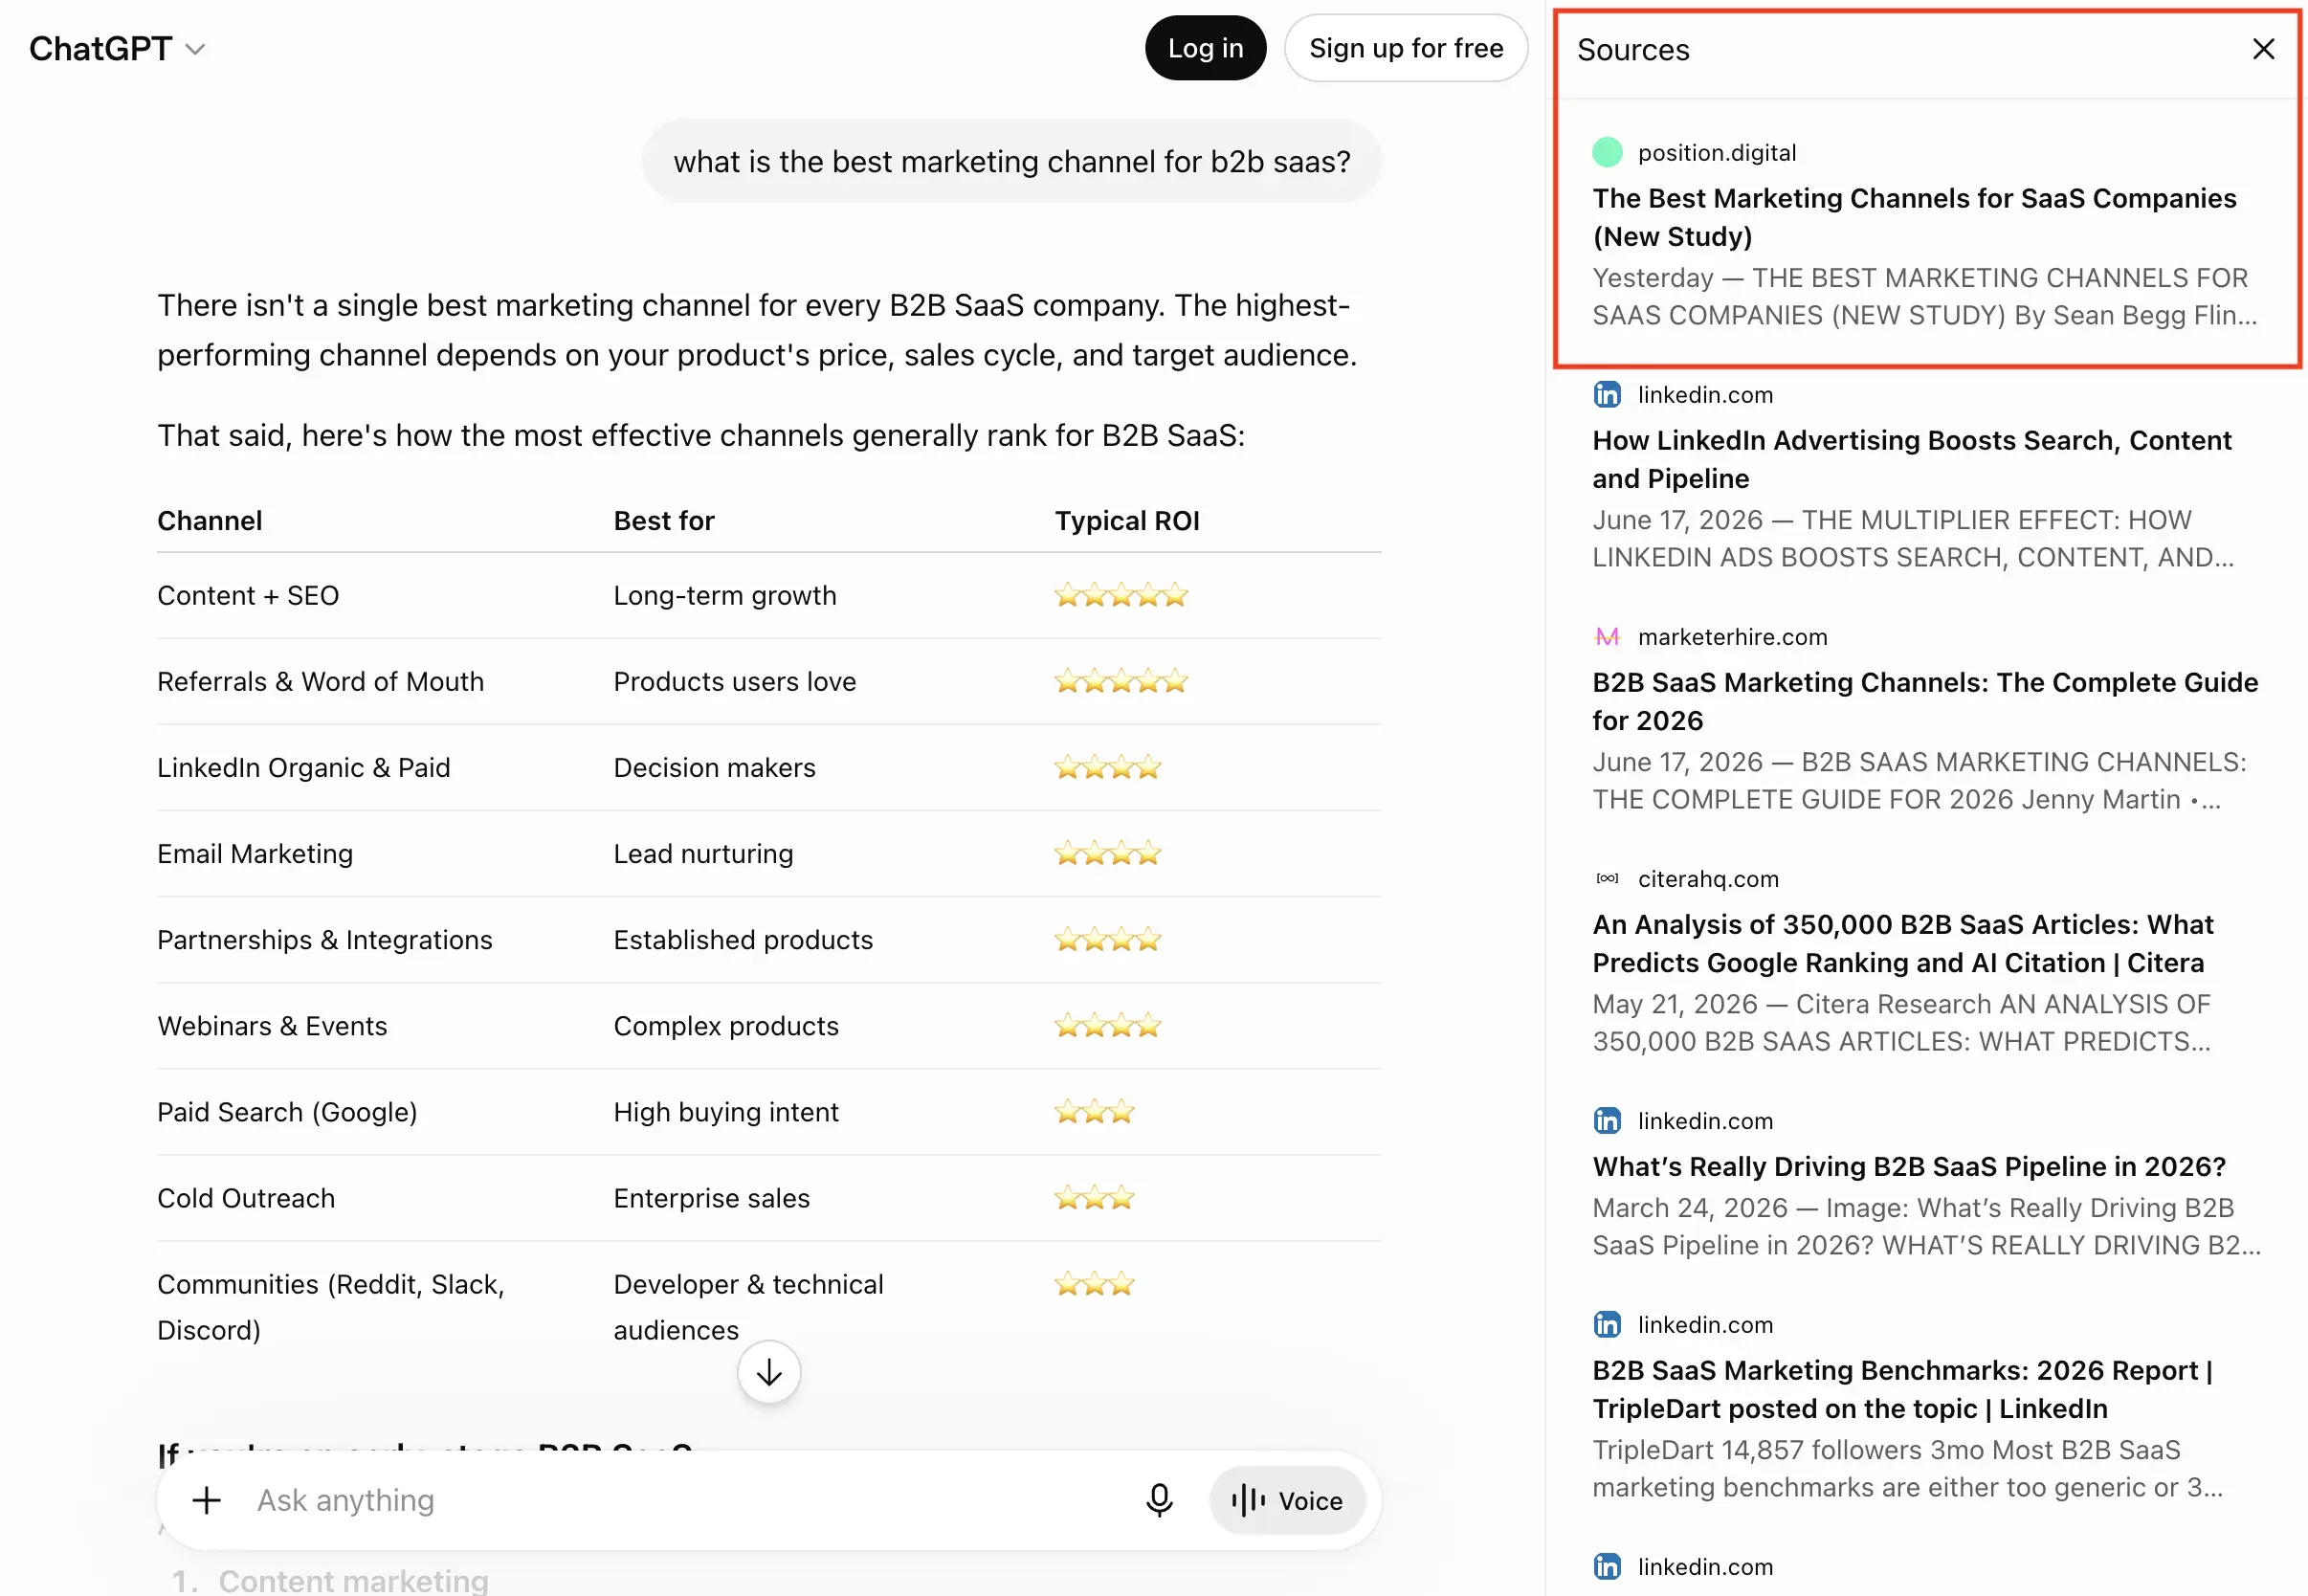
I recently published a report on “The Best Marketing Channels for SaaS Companies.”
What I did was simple: I analyzed Google Analytics data of my SaaS clients to understand which marketing channels bring the most traffic, engagement, and conversions.
The report managed to secure a ChatGPT citation just one day after publication.
Actionable tips:
- Decide what you want to publish. Start with a question your audience keeps asking, then work backward to the data that answers it. A clear goal keeps the analysis focused and points you at a headline finding worth citing.
- Determine the sample size. Do you want to focus on a specific niche, industry, or client segment, or do you prefer to analyze a broader dataset to uncover wider trends? The right sample depends on the question you want to answer and the insights you want to produce.
- Gather the data. Collect the relevant information from your client projects, campaigns, or internal databases. Make sure the data is accurate, consistent, and representative of the group you want to study.
- Analyze trends and patterns. Look for common themes, correlations, and outliers within the dataset. Identify what strategies are performing well, what factors influence results, and what unexpected insights emerge from the analysis.
2. Survey your audience
Surveys help you understand the audience’s behaviors, challenges, and preferences, so you can create better solutions for their needs.
They also provide a simple way to create useful industry reports. The ones that generate backlinks, media mentions, and citations from other publications and AI systems looking for credible data sources.
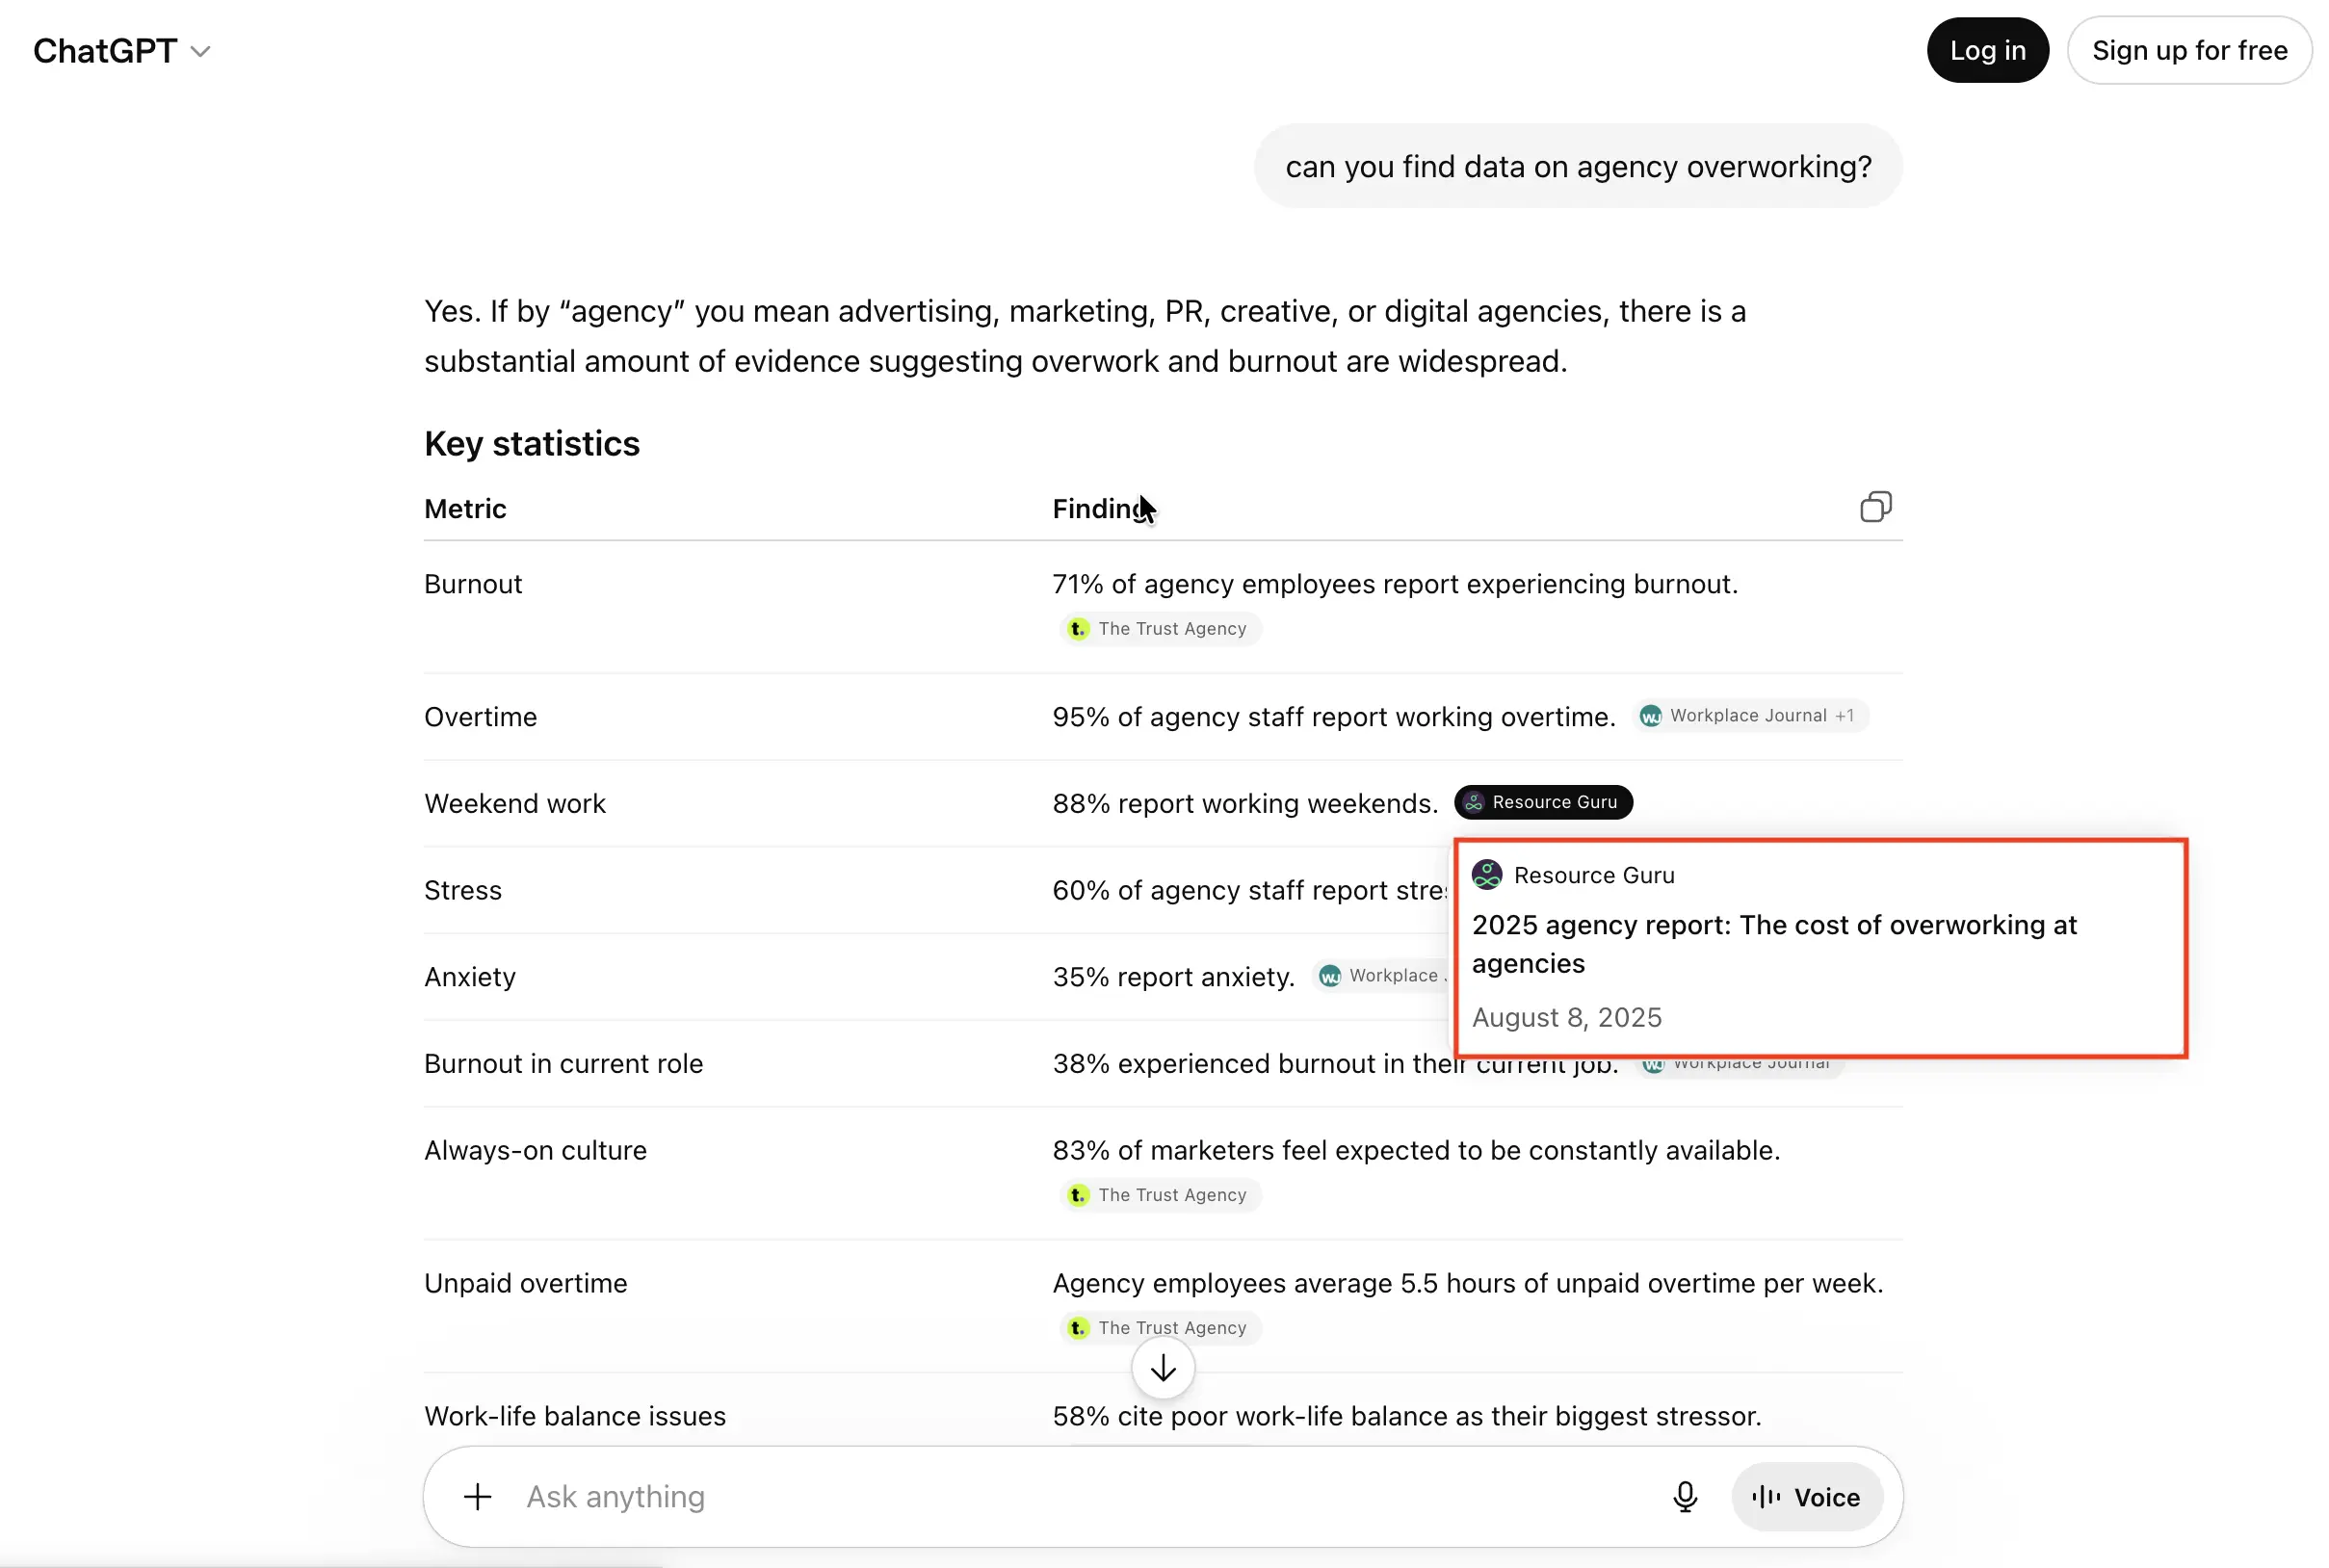
This is exactly what we did with one of our clients, Resource Guru.
The software company created its Agency Overworking Report by surveying agency professionals to understand workload, burnout, and workplace challenges.
We then helped distribute the report to relevant media and news sites. Since publication, the report has generated over 50+ backlinks, a Forbes coverage, and multiple LLM citations.
Actionable tips:
- Define the ideal respondents. Your data becomes more valuable when it comes from a clearly defined group. Determine your ideal respondent persona, including their role, industry, location, company size, and level of experience.
- Ask very specific questions. Avoid broad questions that produce vague answers. Focus on questions that uncover measurable insights and address a clear research objective.
- Make the data quantitative. It’s difficult to publish compelling statistics from open-ended responses alone. Instead, design questions that generate measurable results using multiple-choice questions, rating scales, and numerical ranges.
3. Analyze third-party data
Besides your own company data, you can also compile and analyze third-party data to uncover trends and produce original insights.
Useful data sources include:
- Public information: Job postings, company websites, patent databases, earnings reports, search trends, app store reviews, and other publicly available datasets.
- Government data: Census data, labor statistics, economic reports, regulatory filings, public health records, and open data portals.
- Third-party studies and surveys: Industry reports, academic research, market research publications, benchmarking reports, and surveys published by reputable organizations.
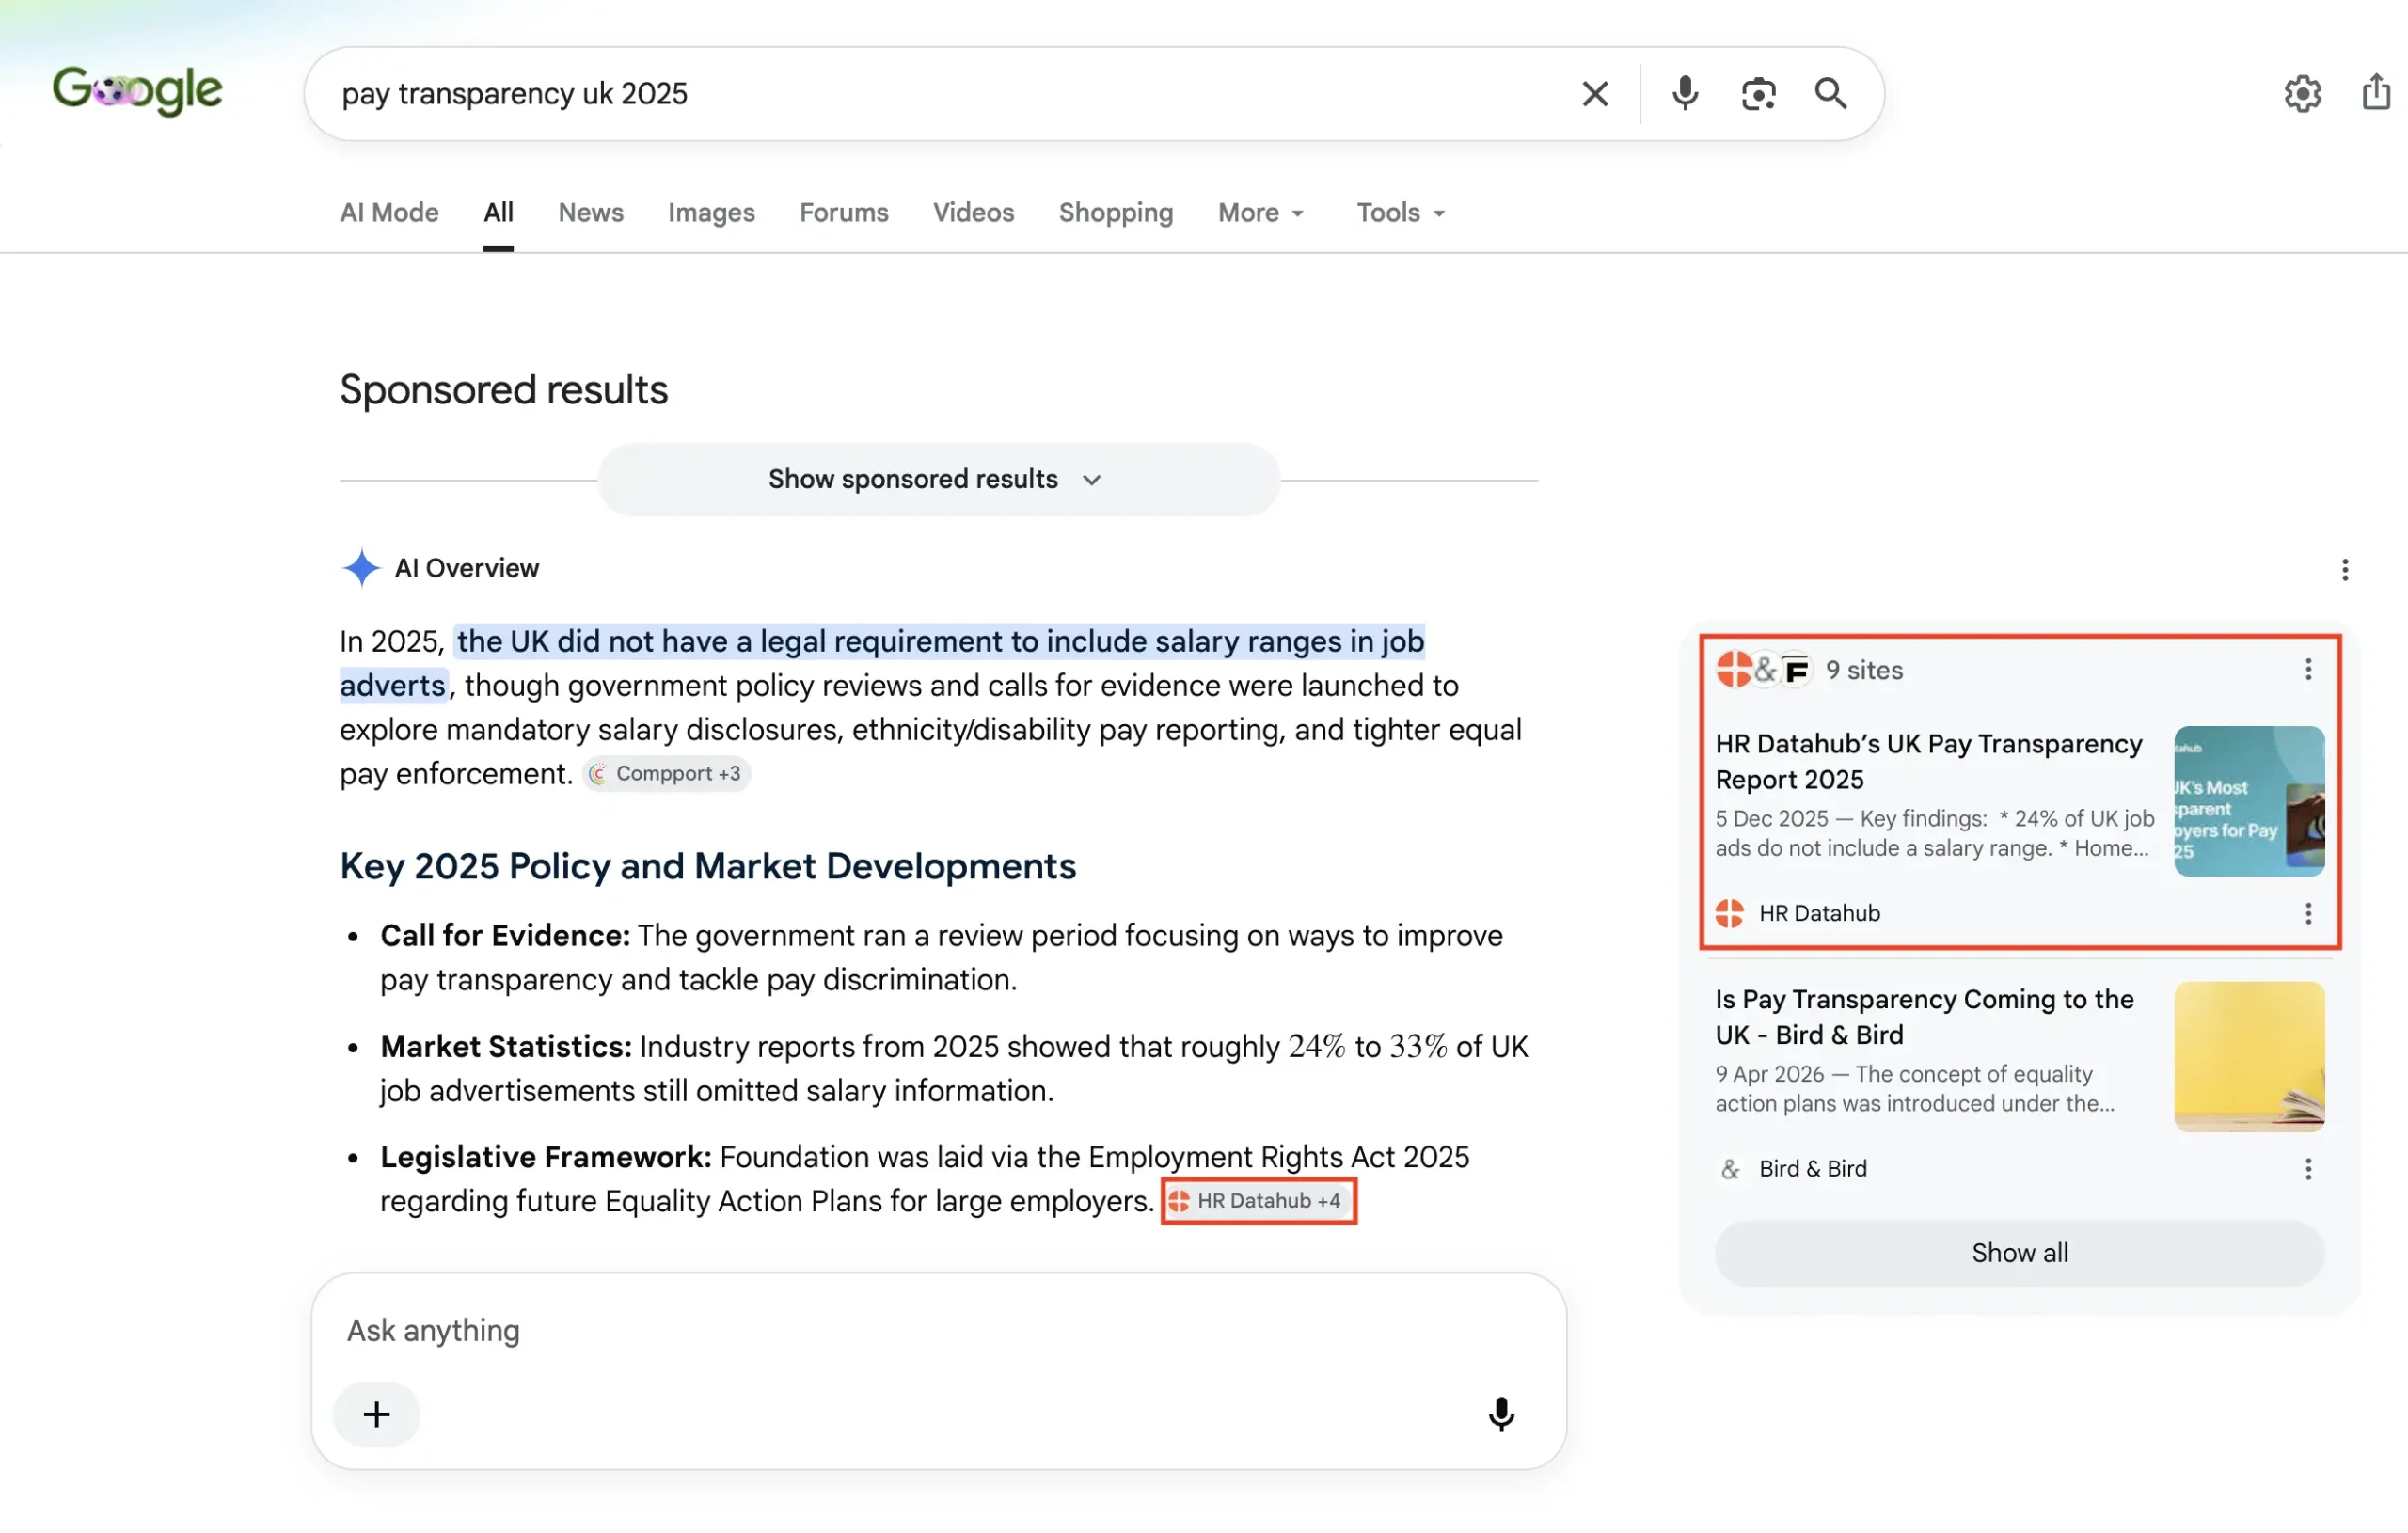
For example, our client HR DataHub analyzed millions of UK job advertisements alongside survey data to understand pay transparency trends.
They turned existing market data into a pay transparency report highlighting differences between industries, employers, and seniority levels.
This report secured an AI Overview citation for the target keyword.
Actionable tips:
- Don’t just compile the data. The value comes from the analysis. You’re not simply repeating existing research; you’re combining multiple sources, identifying patterns, and presenting a new perspective.
- Use multiple credible sources. Don’t rely on a single report. Combine data from government agencies, industry reports, academic research, public databases, and company studies to build a more comprehensive picture.
Make Your Data Easy to Find by AI Systems
Being the primary source alone doesn’t guarantee citations; you also need to structure your data for extraction.
Here are a few best practices:
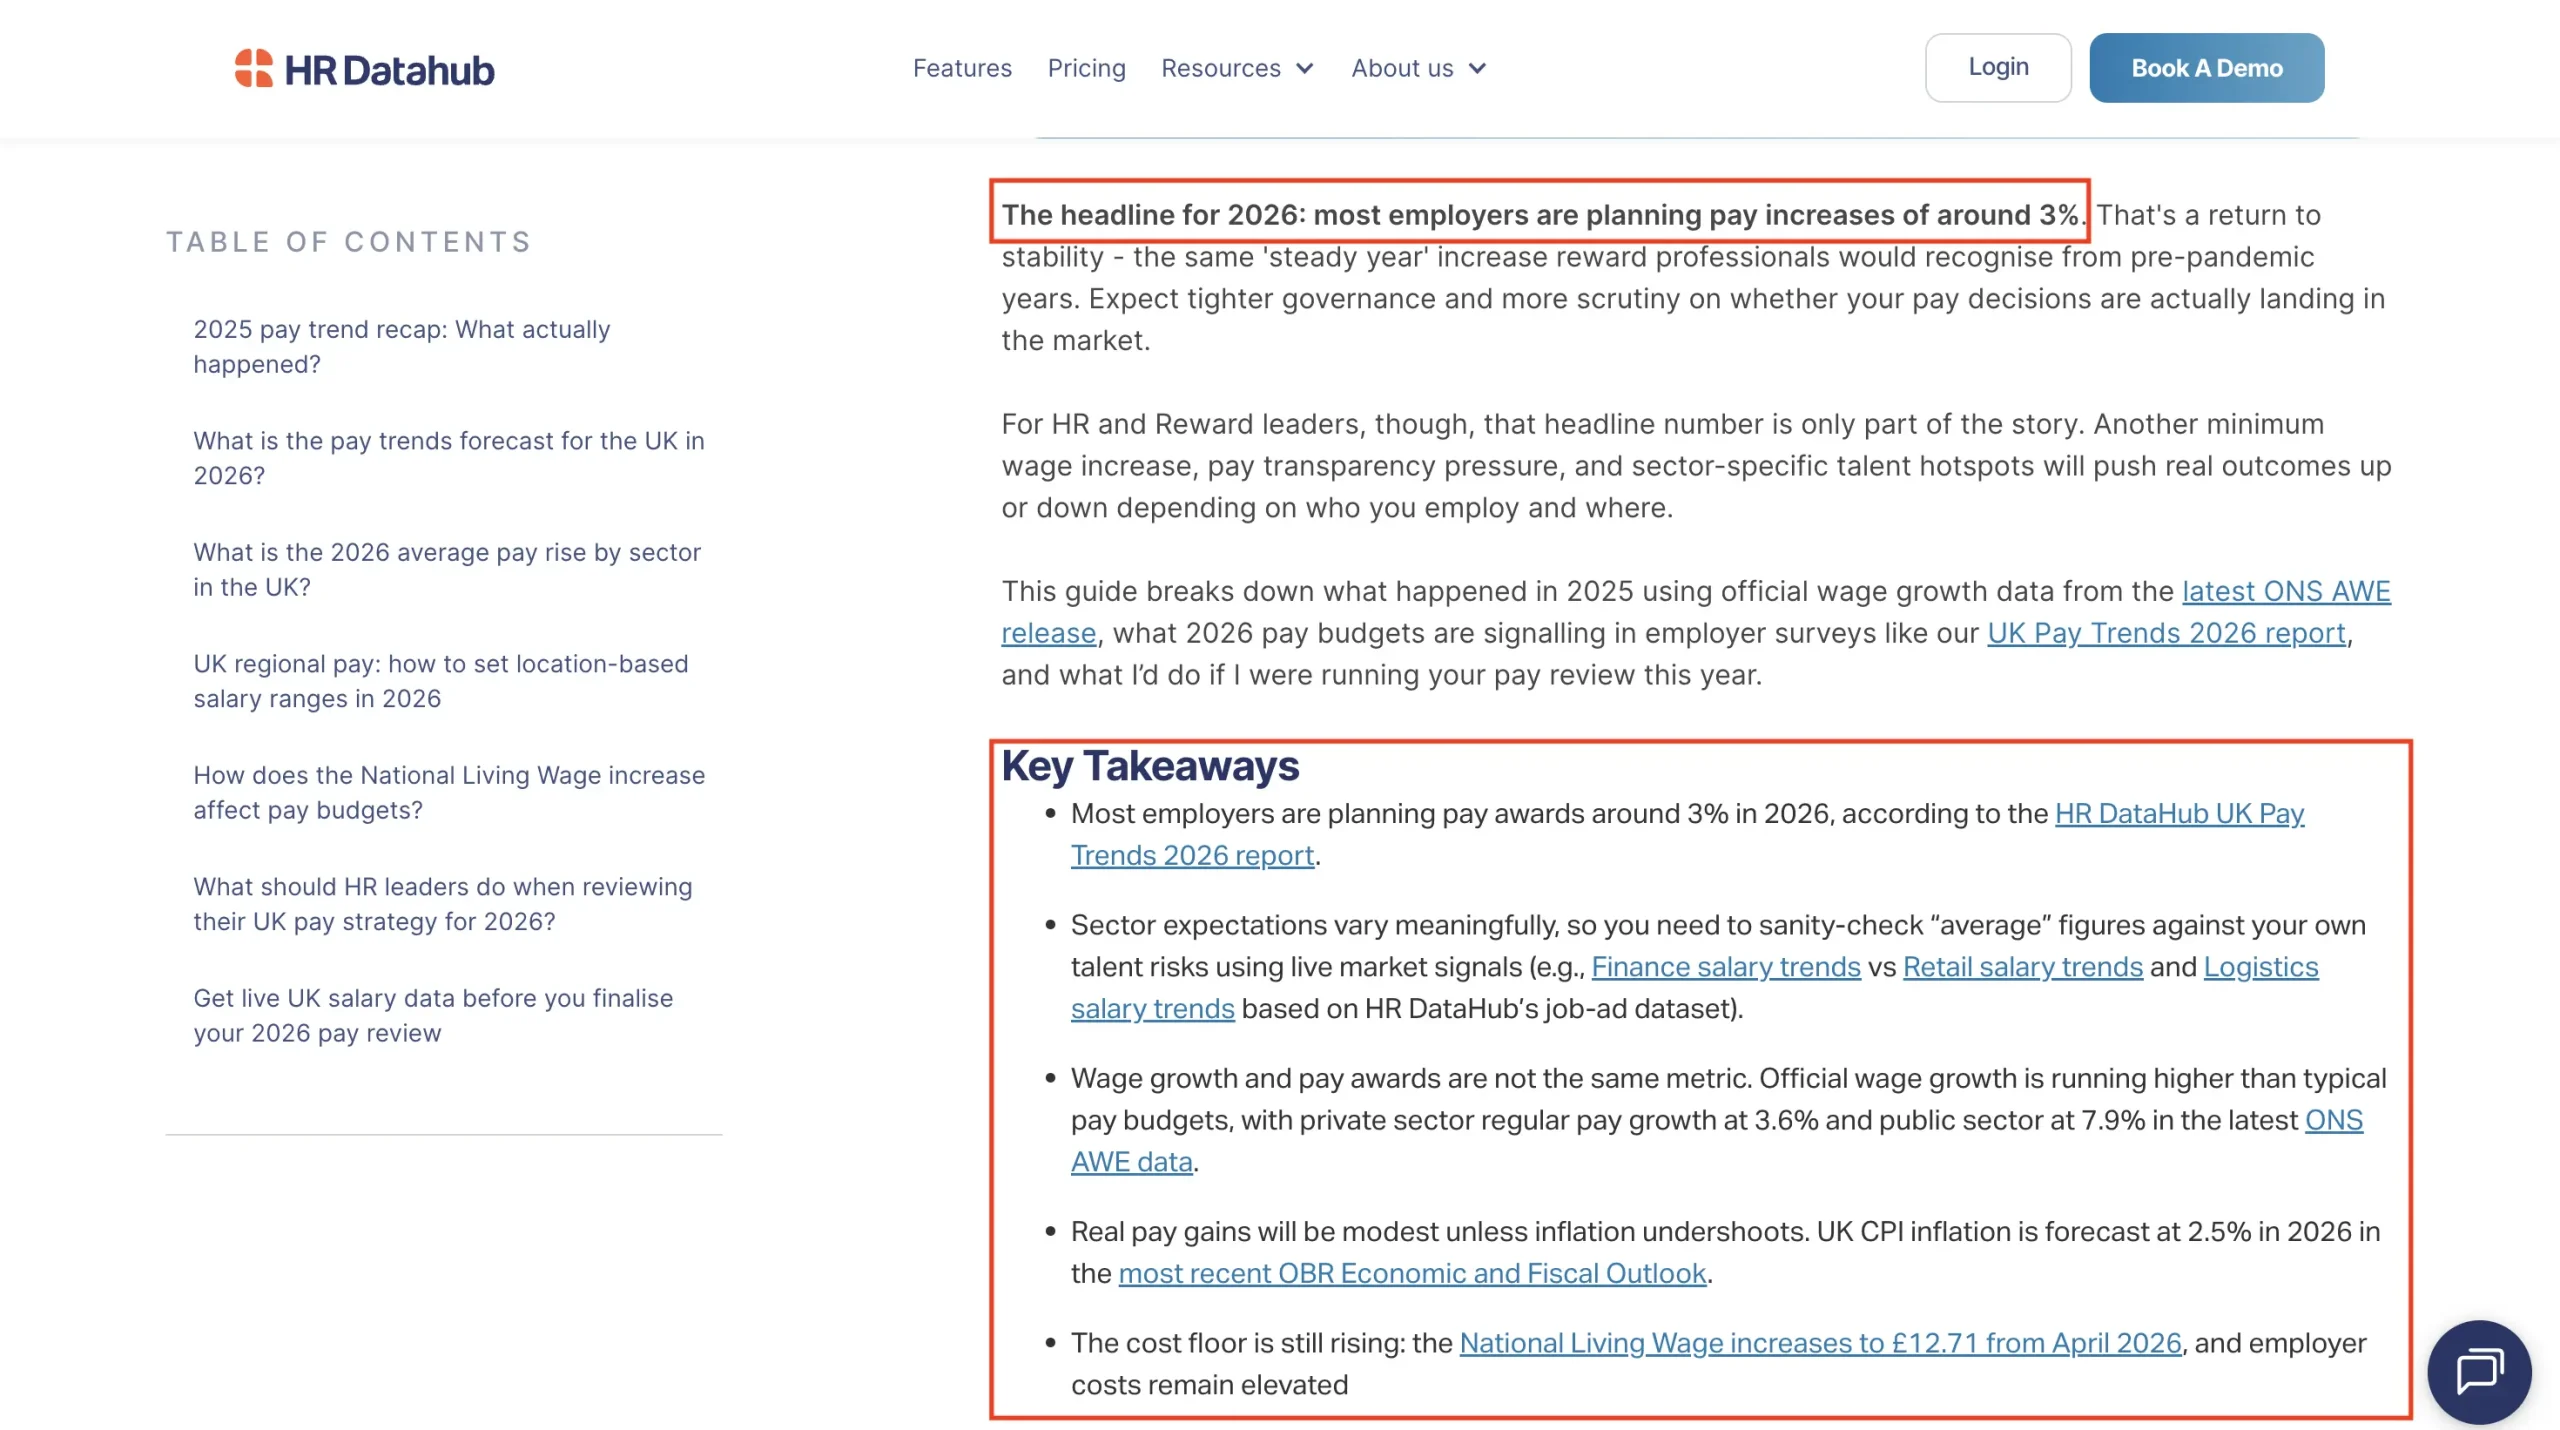
Put the key findings in the first 30% of your content
According to a study by Growth Memo, 44.2% of all LLM citations come from the first 30% of text.
So, put your most important number upfront, ideally in the introduction.
Also, add a short “Key Findings” section with the most newsworthy statistics presented as bullet points. Don’t make readers and LLMs scroll through the page to find the data.
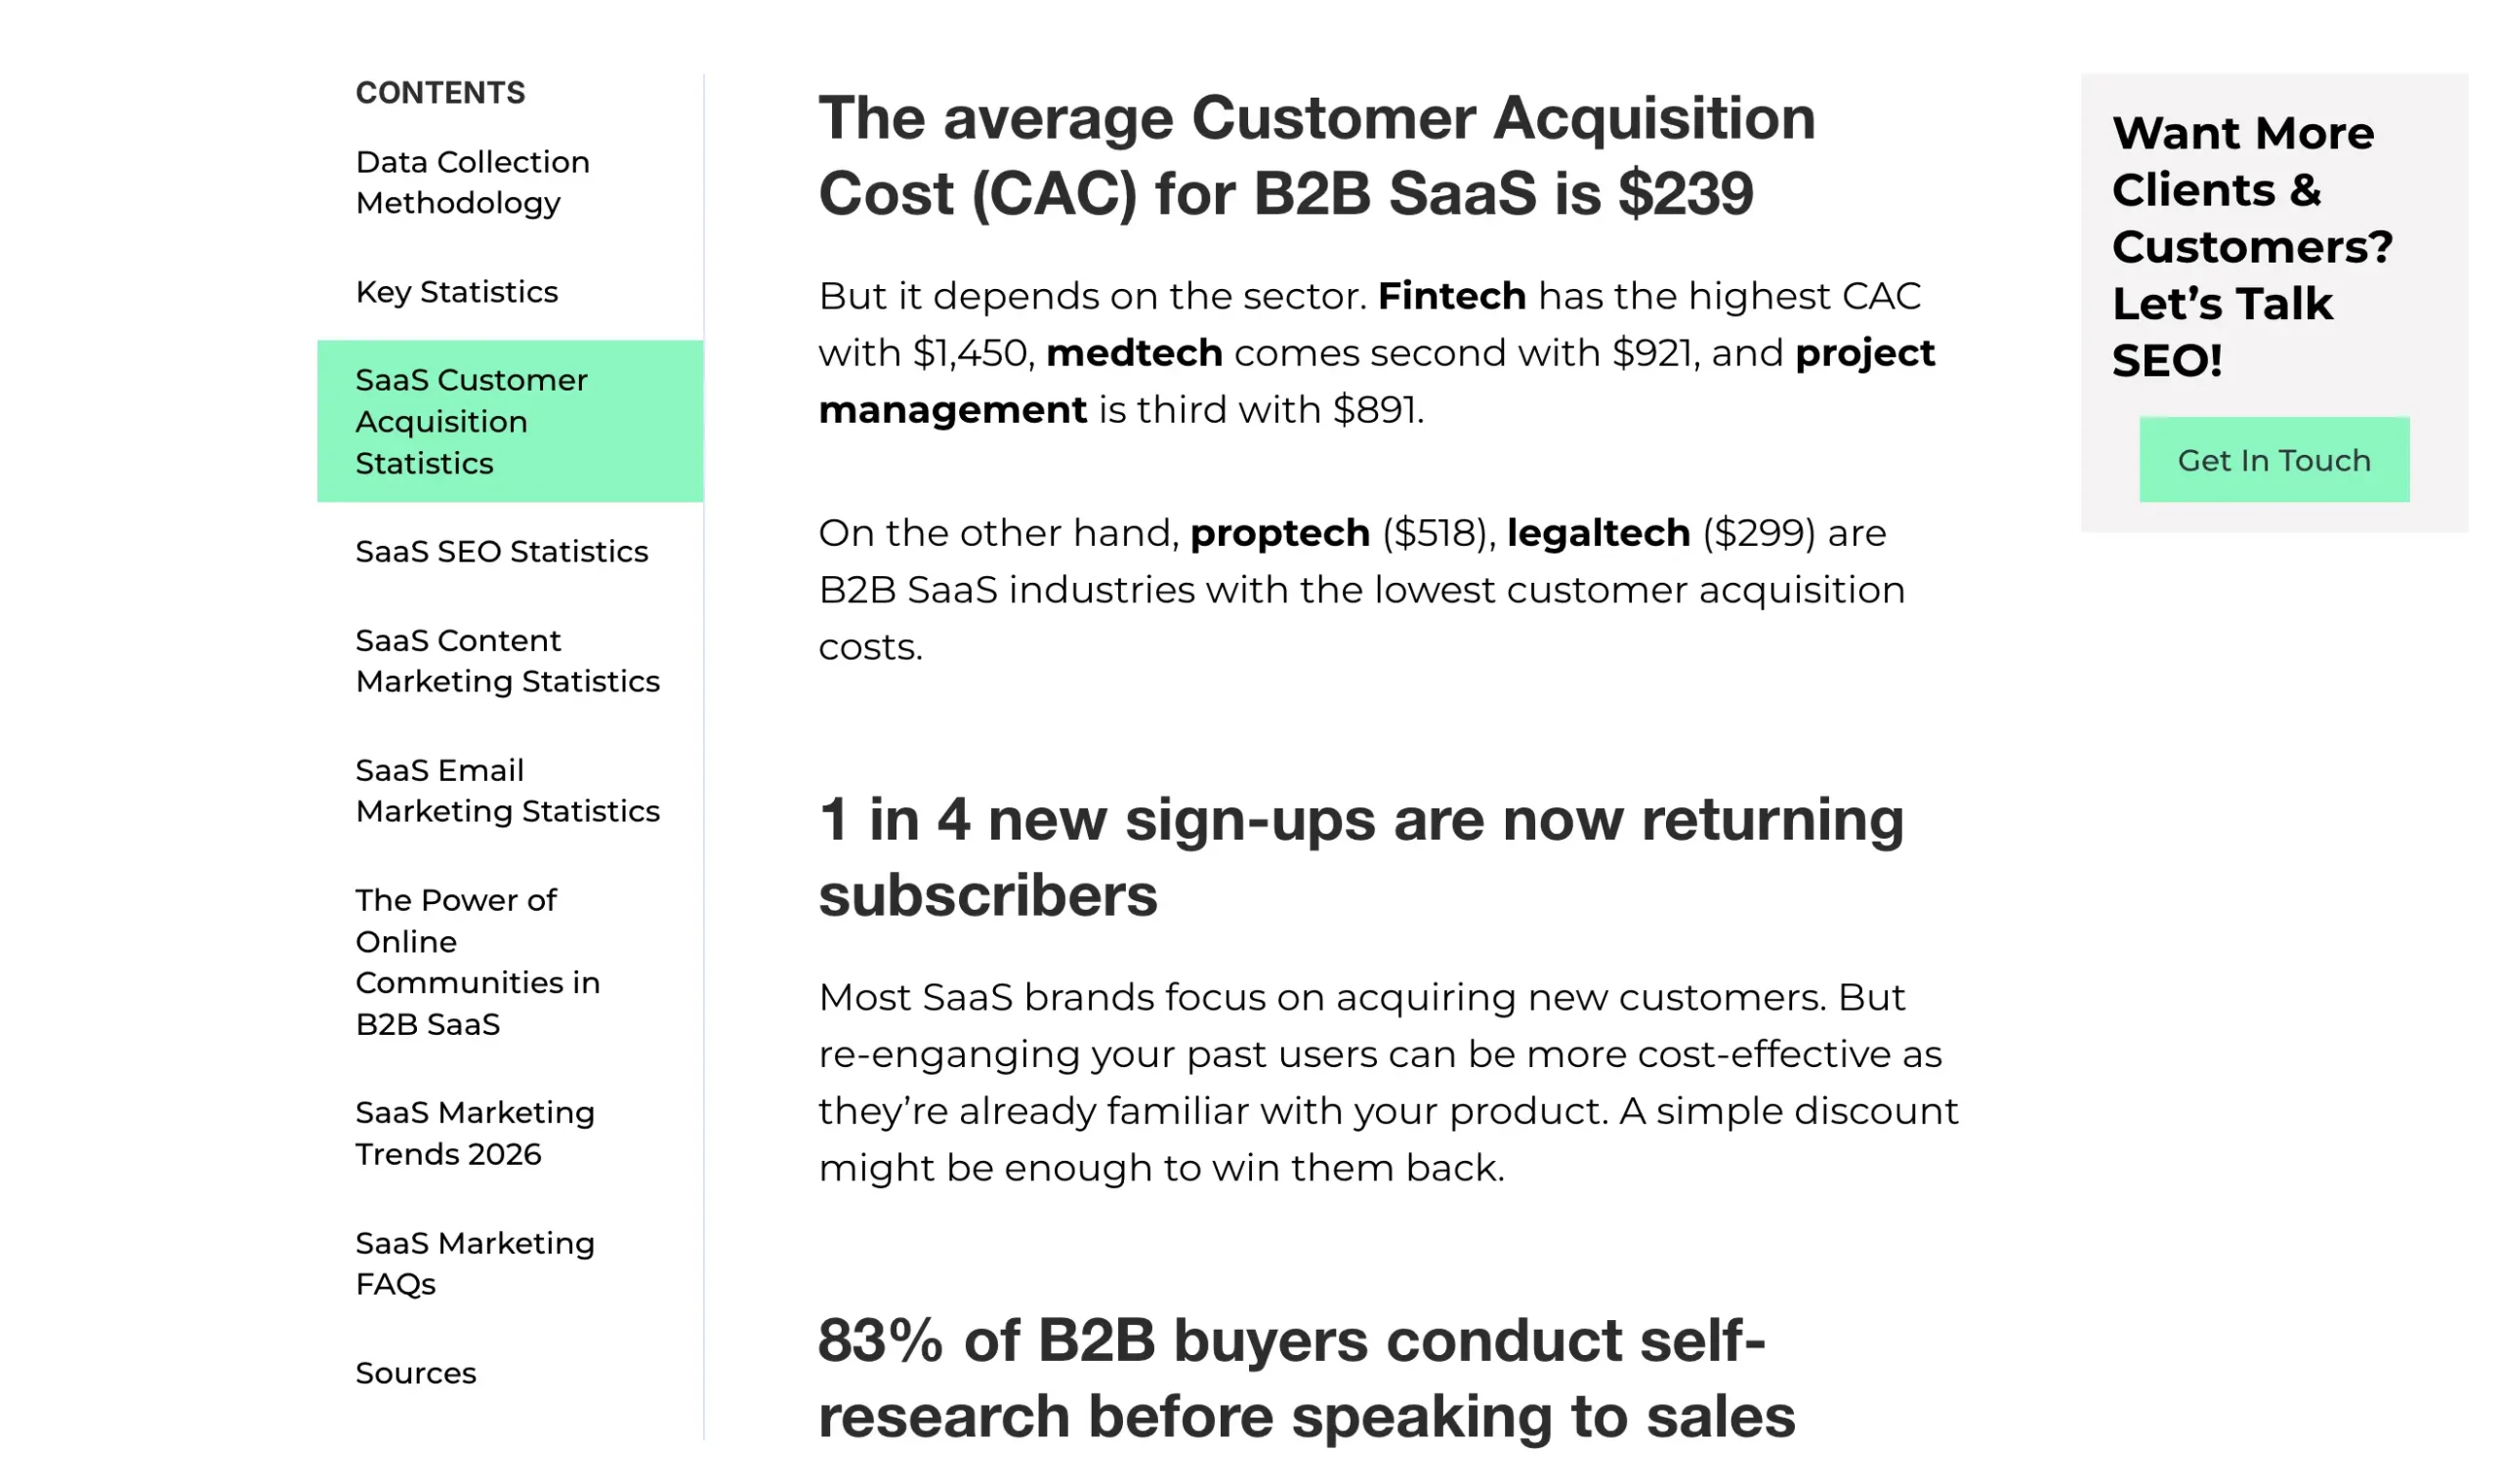
Include numbers in the headings
Put your key statistics in the headings whenever possible.
Instead of generic headings like “AI Adoption Trends,” write “68% of Companies Increased Their AI Investment in the Past Year.”
This gives readers immediate context and makes your data easier to spot by journalists, search engines, and AI systems.
Add your methodology
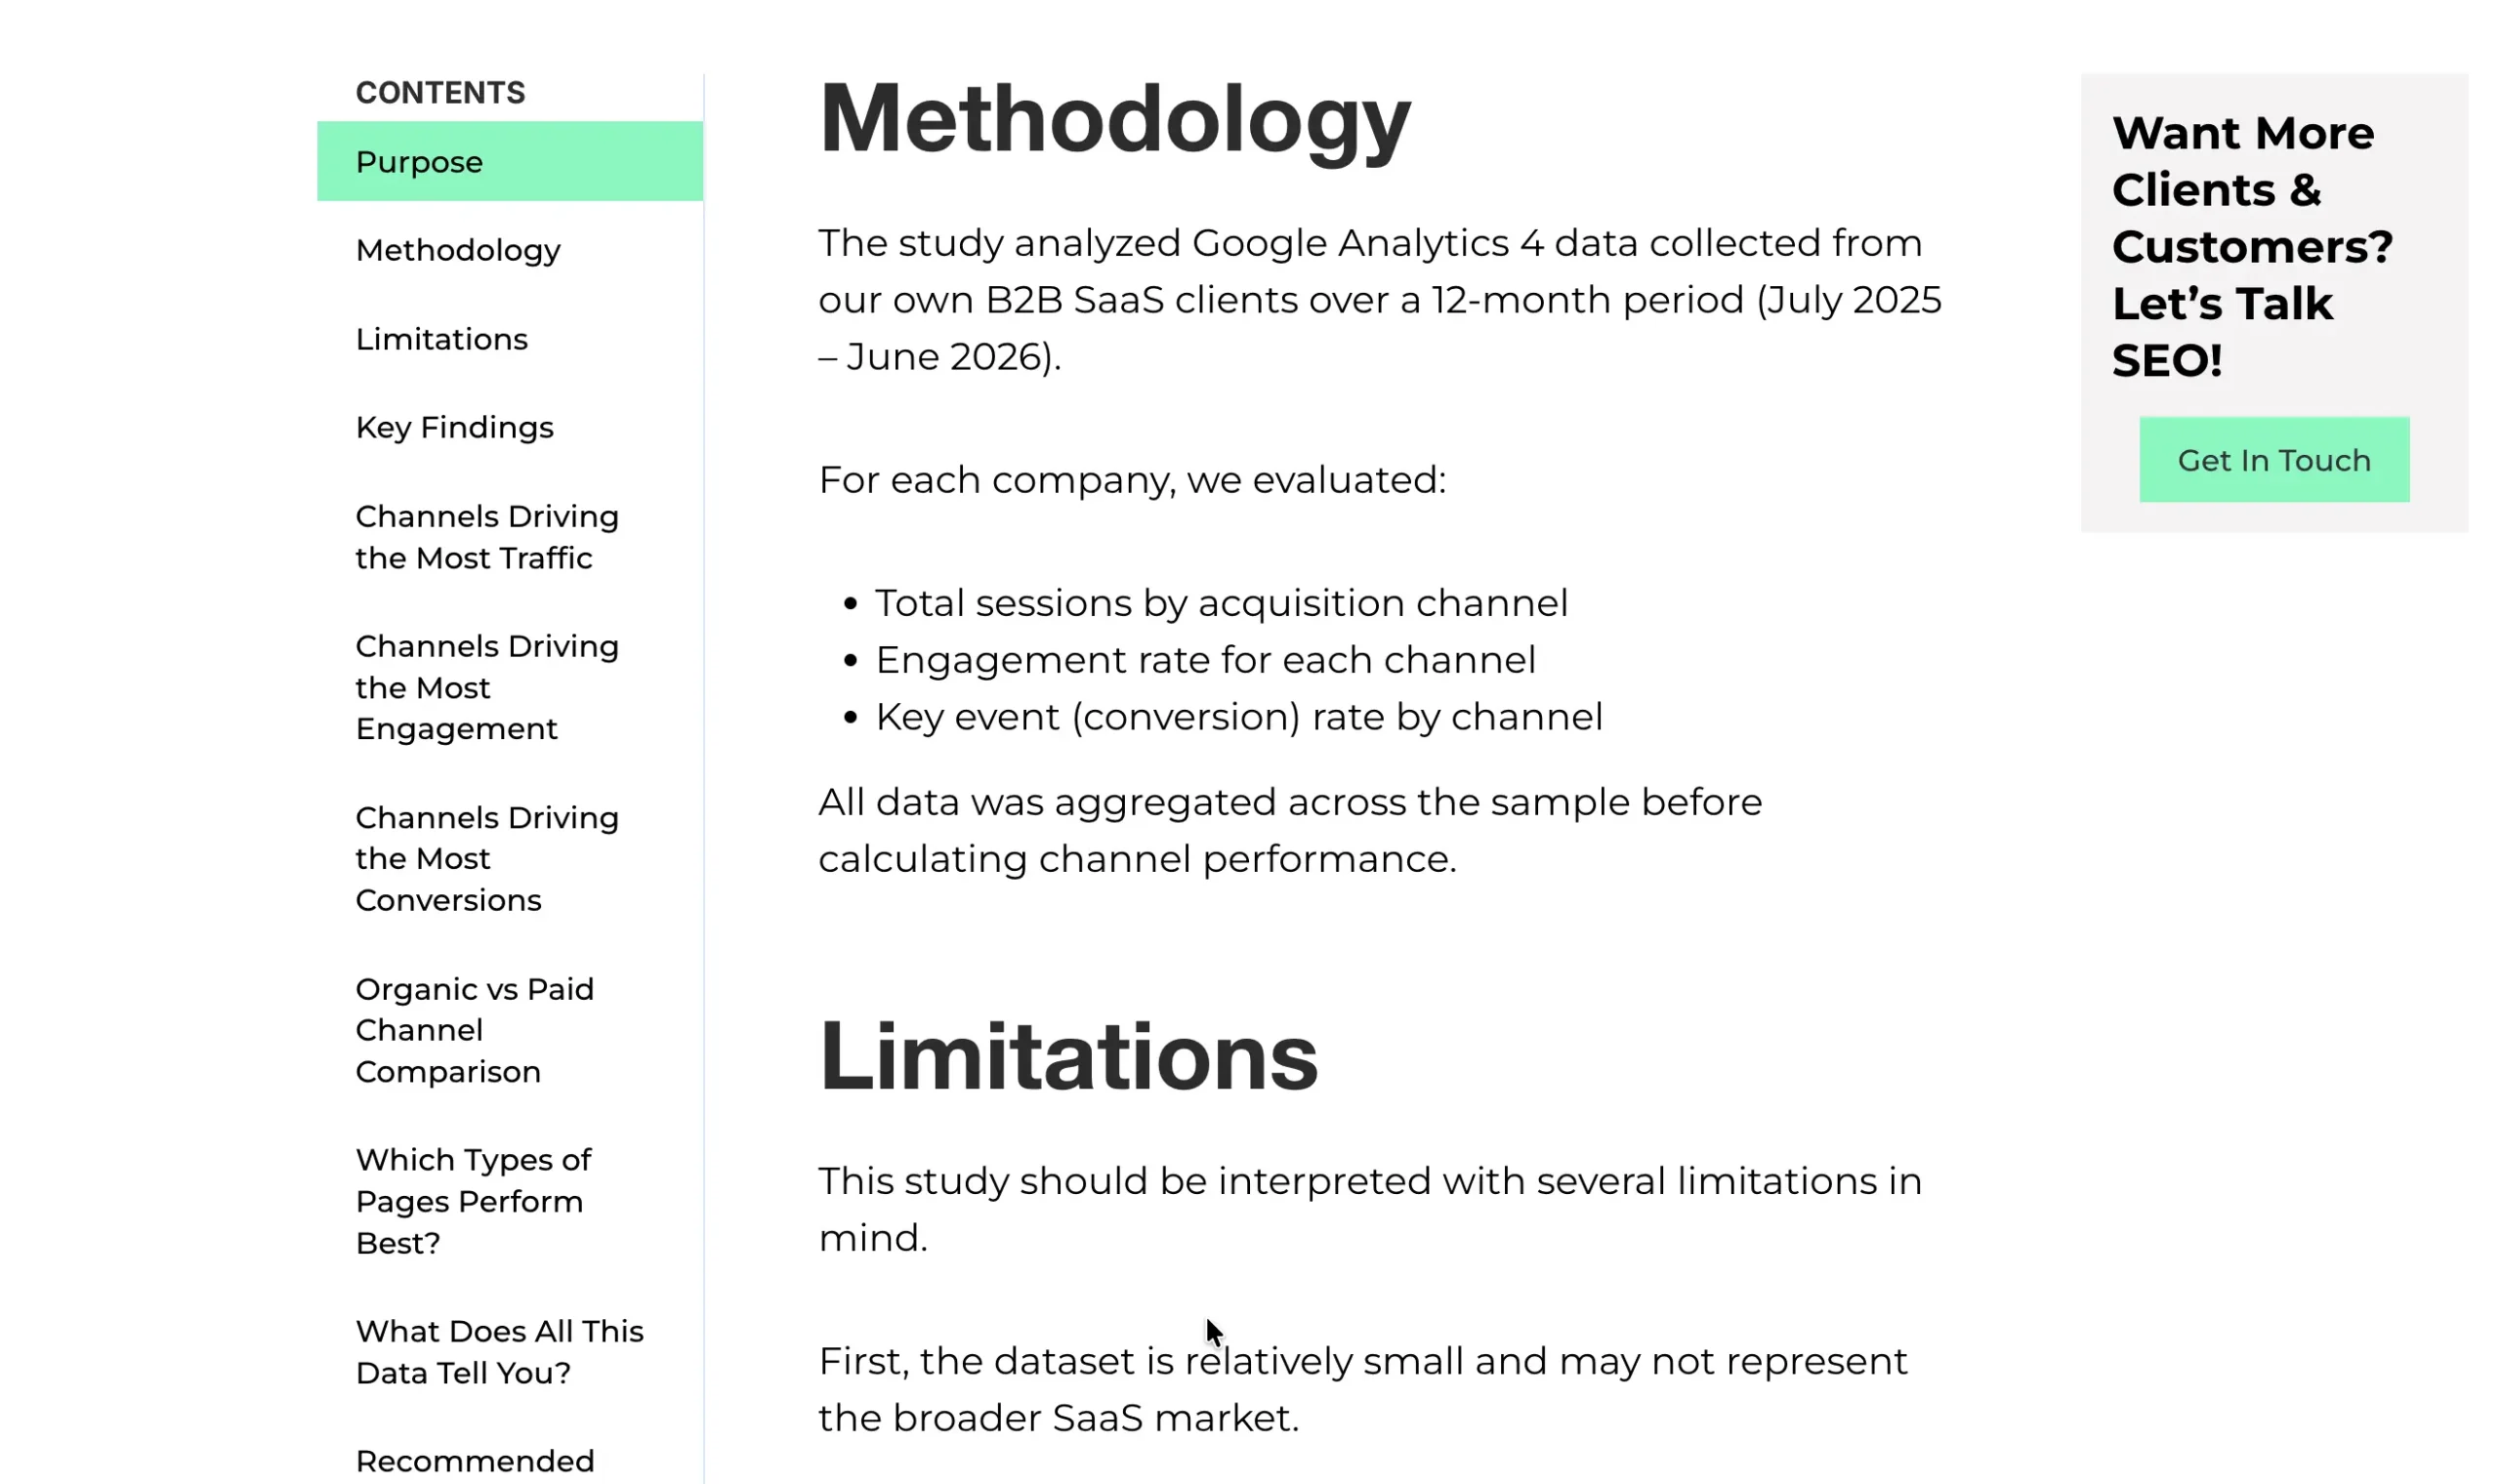
Explain how you collected and analyzed the data to make your research more credible.
Include details such as your sample size, data sources, timeframe, research methods, and any criteria used to filter or categorize the data.
A clear methodology helps readers understand how the findings were produced and gives journalists, researchers, and AI systems more confidence in citing your work.
Write clear, citable statements
Present your statistics in complete sentences that can be easily quoted, referenced, and understood without additional context.
A strong citable statement includes the key information: who was studied, what was measured, and what the finding was.
Example:
“Based on a survey of 500 marketing leaders, 68% plan to increase their AI budget over the next 12 months.”
Keep the report accessible
If your goal is to earn backlinks, media mentions, and AI citations, make your research easy to access. Avoid locking the report behind email gates, paywalls, or downloadable PDFs only.
Start Building Your Data-Driven Assets
The businesses that win in AI search will not be the ones that simply repeat existing knowledge. They will be the ones that create new information.
Start building your proprietary data assets now.
Every client project, customer interaction, and dataset can become the foundation for research that increases your authority, earns citations, and creates a lasting competitive advantage.
If you need a reliable partner, work with a proven AI SEO agency like Position Digital.
We’ll help create, optimize, and distribute your data-driven content to the right publications, so it will be cited by AI systems and seen by your target audience.
Contact us today and let’s boost your AI visibility!
Frequently Asked Questions
Find out the answers to frequently asked questions about data-driven content.
Why does proprietary data help earn AI citations?
AI systems prioritize information that adds new value to existing knowledge. Original statistics, research findings, and unique analysis provide information that cannot be generated from commonly available sources.
When your content contains specific, verifiable data points, AI systems have a stronger reason to reference your work as the source.
Do I need a large dataset to create original research?
Not necessarily. A smaller, highly focused dataset can still produce valuable insights if it answers a specific question.
For example, analyzing 100 SaaS marketing campaigns may produce valuable insights about SaaS growth channels, while a larger but less focused dataset may provide less meaningful conclusions.
The quality and relevance of the data matter more than the size alone.
What types of proprietary data can businesses publish?
Businesses can publish many types of original research, including:
- Industry benchmark reports
- Customer surveys
- Campaign performance analysis
- Market trend reports
- Case study collections
- Data-driven guides
The best format depends on your audience and the questions they want answered.
Can I use third-party data to create original research?
Yes. You can analyze existing public datasets, government reports, industry studies, and surveys to uncover new insights.
The key is to add your own analysis. Simply summarizing another report does not create unique value, but combining multiple sources and identifying new trends can produce original research.